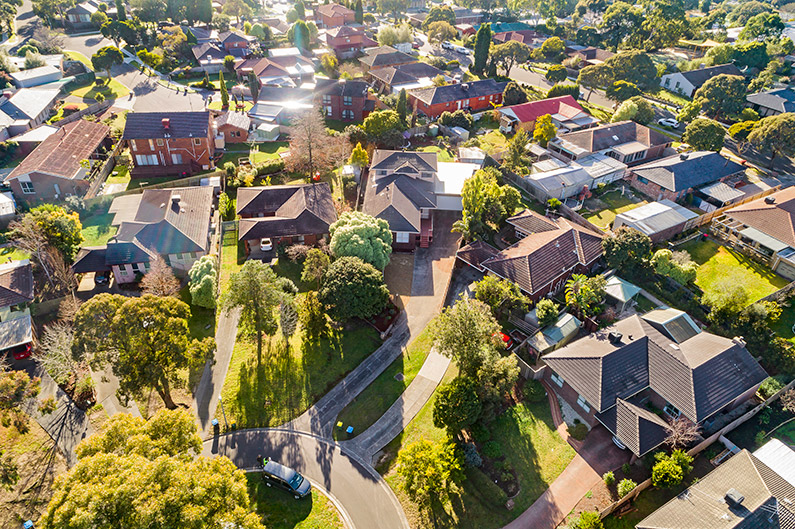
As the days get longer and higher temperatures begin to coax us outdoors, the real estate industry gears up for another ‘spring selling season’ following what has been a significant growth quarter for Melbourne, the world’s most liveable city.
Receiving a perfect score for healthcare, education and infrastructure by the Economist Intelligence Unit for the seventh year in a row, Melbourne came out on top in terms home value growth last quarter, outperforming the nations other capital cities.
During the winter period, dwelling values in the city jumped 1.9 per cent, with some of the outer suburbs experiencing a staggering 10 to 20 per cent price growth.
Experts say Melbourne’s low levels of available housing stock and relative affordability compared to Sydney, are keeping the market afloat. However, price growth is tipped to moderate by the end of the year, with more homes likely to hit the market now that spring has arrived.
Melbourne home values—which take into account both houses and units—are 12.7 per cent higher than they were a year ago.
Australia’s most expensive property market, Sydney, has enjoyed 13 per cent annual price growth to a $909,914 median, but experienced just 0.3 per cent quarterly gains and no change in August.
Value growth was also soft across the combined capitals, up just 0.6 per cent in the quarter—the lowest rolling quarterly gain since June last year—and 0.1 per cent last month.
CoreLogic head of research Tim Lawless said the nation’s property market slowdown was “most visible” in Sydney, while Melbourne had been “more resilient”.
This resilience was reflected in auction clearance rates in Melbourne, which has consistently remained above 70 per cent.
Melbourne’s median house price is now $822,000, with an average of 29 days on market.
Spotlight On Our Backyard
A quick look at local stats revealed some surprising results this quarter, with some of the higher priced pockets slightly decreasing in value, as the outer eastern suburbs soared. Croydon recorded Melbourne’s highest median price growth for the quarter at a staggering 20%.
July – August 2017 Snapshot
| Suburb | Median | Days on Market | Quarterly Growth |
|---|---|---|---|
| Camberwell | $2.11 Mil | 33 | 8.1% decrease |
| Balwyn | $2.26 Mil | 32 | 4.6% increase |
| Box Hill | $1.79 Mil | 33 | 4.4% increase |
| Mont Albert | $1.86 Mil | 32 | 12.4% decrease |
| Blackburn | $1.43 Mil | 29 | 4.6% increase |
| Mitcham | $1.04 Mil | 29 | 4.2% decrease |
| Doncaster | $1.5 Mil | 36 | 11.4% increase |
| Wantirna | $957,000 | 26 | 5.1% increase |
| Ringwood | $948,000 | 26 | 11.9% increase |
| Croydon | $810,000 | 24 | 20.4% increase |
Data Source: reiv.com.au
First Homebuyers Turn To Mum and Dad
With some of Melbourne’s ‘more affordable’ pockets going up by as much as $150,000 in three months, first home buyers are relying more and more on their parents to get a foot in the property door.
According to new research, the ‘Bank of Mum and Dad’ is now the nation’s fifth largest mortgage lender after the big four banks.
The data from financial comparison website mozo.com.au reveals 29 per cent of Australian families offer financial help to their kids, lending an average amount of $64,206.
Mozo director Kirsty Lamont said the popularity of the ‘Bank of Mum and Dad’ showed Australia’s property market was not readily accessible to younger generations.
“With Australian property prices rising by 618 per cent over the past 30 years and national incomes failing to keep up, the ‘Bank of Mum and Dad’ is proof of family generosity, but also points to a broken property market for younger generations,” she said.
Finance
There are mixed predictions from economists as to whether we are likely to see an interest rate rise or several concurrent rises in the near future. The Reserve Bank of Australia’s next meeting to decide on the official cash rate target will be held on the 3rd of October. The current cash rate is at a historical low of 1.5 per cent with the average variable loan around 4.99 per cent.
Source: heraldsun.com.au, news.com.au, realestate.com.au, reiv.com.au.


